Dashboard Chart Item
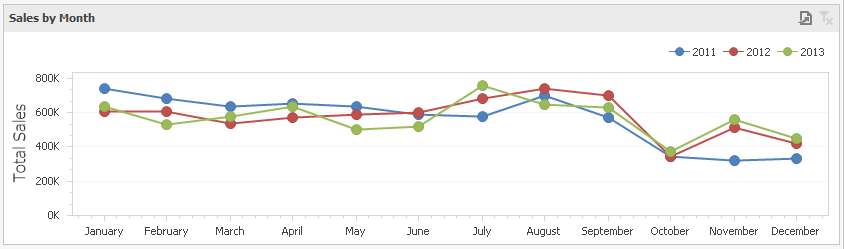
Providing Data
Data Sections
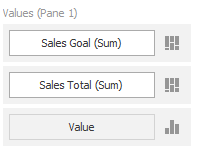
Values
The Values section holds data items against which the Y coordinates of data points are calculated.
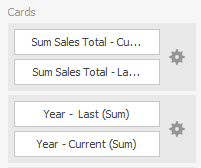
Arguments
The Arguments section holds data items that provide values displayed along the X-axis.
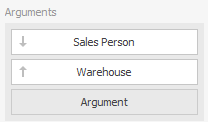
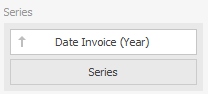
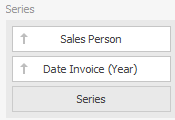
Chart Series
The Series section holds data items whose values are used to create chart series.
Series
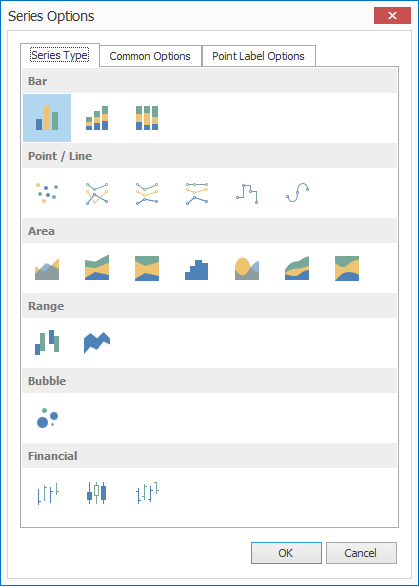
The Chart Dashboard item supports various types of series.
- To change a series types, click the options button near the data item (or a placeholder) in the Values section.
- In the invoked Series Type dialog, select a required series type and click OK .
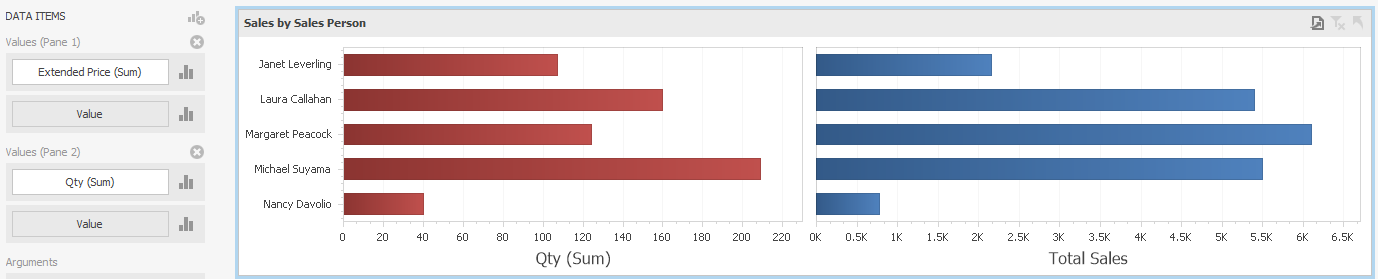
Panes
Chart dashboard items can contain any number of panes. Panes are visual areas within a diagram that display chart series.
Each pane has its own Y-axis, and displays a specific set of series. All panes in a chart share the same X-axis.
Add a Pane
- To add a pane, click the button at the top right of the Data Items area.

Once a new pane is added, the Dashboard Designer creates another Values section in the data Items area.
Remove a Pane
- To remove a pane, click the button displayed in the corresponding Values section.

Interactivity
The Dashboard allows you to use any data-aware dashboard item as a filter for the entire dashboard (Master Filter).
When Interactivity is enabled, an end-user can click a grid row to make other dashboard items only display data related to the selected record.
Filtering by Arguments
The Chart dashboard item supports filtering by argument or series values.
When filtering by arguments is enabled, the end-user can click a series point to make other dashboard items display only data related to the selected argument value.
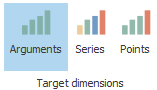
- To enable filtering by arguments, click the Arguments button on the Data – Target dimensions menu.
Filtering by Series
When filtering by series is enabled, an end-user can click a series point to make other dashboard items display only data related to the selected series.
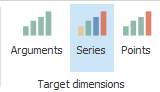
- To enable filtering by arguments, click the Series button on the Data – Target dimensions menu.
Reset Filtering
- To reset filtering, use the Clear Filter button within the Chart caption.

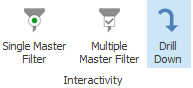
Drill-Down
The built-in drill-down capability allows end-users to change the detail level of data shown in dashboard items on the fly.
The Chart dashboard item supports drill-down on argument or series values.
Drill Down on Arguments
When drill-down on arguments is enabled, an end-user can click a series point to view a detail chart for the corresponding argument value.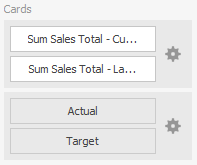


- To drill-down on arguments, click the Drill Down button on the Data – Interactivity menu.
- Click the Arguments button on the Data – Target dimensions menu.
Drill-down on arguments requires that the Arguments section contains several data items, from the least detailed to the most detailed item.

Drill Down on Series
When drill-down on series is enabled, an end-user can click a series point (or corresponding legend item) to view a detail chart for the corresponding series.
- To drill-down on arguments, click the Drill Down button on the Data – Interactivity menu.
- Click the Series button on the Data – Target dimensions menu.
Drill-down on series requires that the Series section contains several data items, from the least detailed to the most detailed item.
Drill-Up
- To return to the previous detail level (drill-up), use the button in the caption of the Chart dashboard item, or the Drill Up command in the context menu.

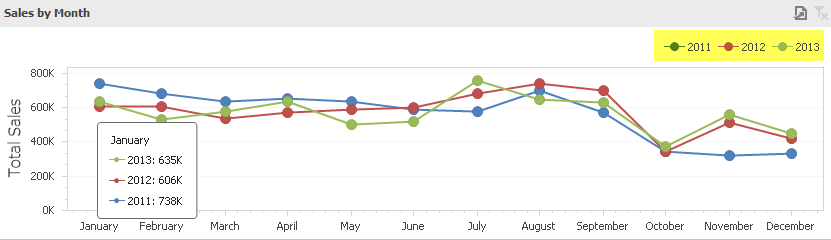
Legend
A legend is an element of a chart that identifies its series.
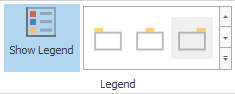
Visibility
You can specify whether or not a chart should display a legend.
- Click the Show Legend button in the Legend menu to toggle this option.
Axes
X-Axes
The X-axis is the axis of arguments.
General X-Axis Settings
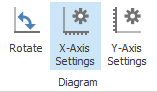
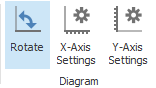
- Click the X-Axis Settings button on the Designe – Diagram menu.
This will invoke the X-Axis Settings dialog.
This dialog contains the following settings:
- Show X-axis : Allows you to hide and show the X-axis.
- Show title : Allows you to hide and show the X-axis title. You can choose whether to use the default text or specify a custom string.
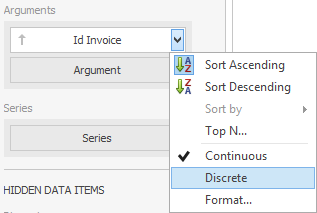
Continuous and Discrete X-Axes
If the dimension in the Arguments section contains numeric data, the Chart can create either a continuous X-axis or a discrete X-axis.
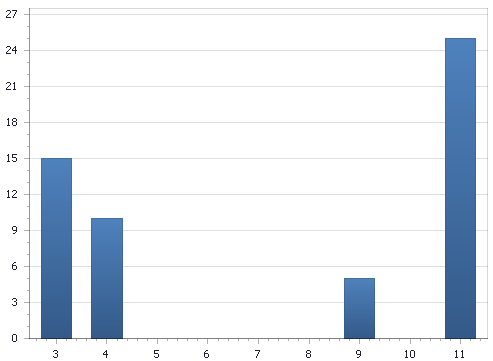
If a continuous axis is used, the distance between argument values is proportional to their values.
On a discrete axis, all argument values are an equal distance from each other.
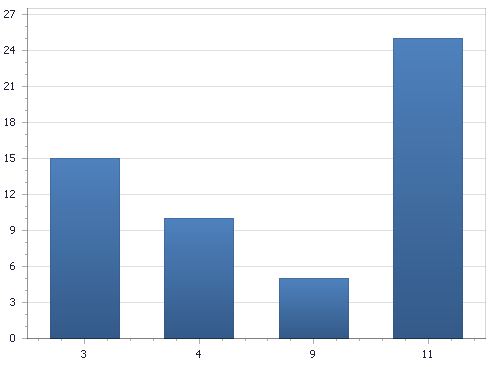
- To specify the X-axis type in the Designer, invoke the data item menu for the argument dimension and select the axis type.
Y-Axes
The Y-axis is the numerical axis of values.
General Y-Axes settings
- Click the Y-Axis Settings button on the Layout & Style – Diagram menu.
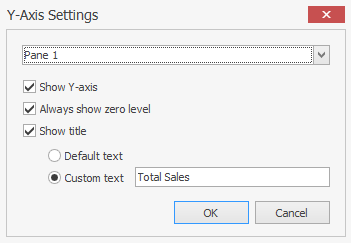
This will invoke the Y-Axis Settings dialog.
- Use the dropdown box at the top to select the pane for the Y-axis settings you need to edit.
The dialog contains the following settings:
- Show Y-axis : Allows you to hide and show the Y-axis.
- Always show zero level : Specifies whether or not the axis’ zero level is visible. If this option is unchecked, the visible axis range is defined based on the values plotted in the chart.
- Show title : Allows you to hide and show the Y-axis title. You can choose whether to use the default text or specify a custom string.
Orientation
You can rotate the Chart so that the X-axis becomes vertical, and the Y-axis becomes horizontal.
- Click the Rotate button on the Layout & Style – Diagram menu.
Legend Position
- Select a legend position from the dialog option.