-
-
-
-
-
- Data Grid
- Data Grid Columns
- Open a Data Grid
- Sort Data Grid Columns
- Filter Data Grid
- Data Grid Grouping
- Merge Cells in Data Grid
- Data Grid Formatting
- Data Grid - Conditional Formatting
- Data Grid - Calculated Fields
- Data Grid Drill Down
- Data Grid Views
- Generate Report from Data Grid
- Refresh Data Grid
- Copy Data Grid Records
- Export Data Grid Data
- Show all articles ( 1 ) Collapse Articles
-
- Pivot Grid
- Pivot Grid Areas
- Pivot Grid Fields
- Pivot Grid Summarize
- Format Pivot Grid Fields
- Expand - Collapse Pivot Grid Columns
- Sort Pivot Grid
- Pivot Grid - Calculated Fields
- Pivot Grid Filters
- Pivot Grid Drill Down
- Pivot Grid Charts
- Pivot Grid Maps
- Pivot Grid Views
- Refresh Pivot Grid
- Export Data from the Pivot Grid
- Embed Pivot Grid into Report
- Show all articles ( 1 ) Collapse Articles
-
-
-
- Dashboard Items
- Dashboard Chart Item
- Dashboard Pie Item
- Dashboard Data Grid Item
- Dashboard Pivot Table Item
- Dashboard Gauge Item
- Dashboard Card Item
- Dashboard Scatter Chart Item
- Dashboard Treemap
- Dashboard Range Filter Item
- Dashboard Filter Elements Item
- Dashboard Text Item
- Dashboard Image Item
- Dashboard Group Item
-
-
-
-
- Schedule Server Jobs
- Add a Schedule Job - Simple Email
- Add Schedule Job - Merged Email
- Add Schedule Server Job - Merged Report
- Add Schedule Job - Alert DBxtra Users
- Add Schedule Server - Export Report Objects
- Add Schedule Job - FTP Upload
- Add Schedule Job - Print Report
- Add Schedule Job – Google Drive Upload
- Add Schedule Job – Dropbox Upload
- Add Schedule Job – Data Dump
- Edit - Delete Schedule Server Jobs
-
-
-
- DBxtra - Excel Reporting Service
- Install the XL Reporting Service
- XL Reporting Service - Driver Requirements
- XL Reporting Service Interface
- Connect Excel Reporting Service to DBxtra Report Repository and Login
- Insert the Report Object's Data into Excel
- Refresh Your Data
- Open DBxtra Reports and Dashboard from within Excel
- XL Reporting Service Security
-
- Articles coming soon
-
-
- Migrating the Report Web Service from legacy (DBxtra version 8.2.3 and prior) to responsive (DBxtra version 9.0.0 +)
- DBxtra version 7.1.0 on Internet Information Server – IIS 6
- DBxtra 7.1.0 on Internet Information Server – IIS 7
- DBxtra version 7.1 – Upgrade DBxtra Report Repository to SQL Server Express.
- How to configure DBxtra to use Internet Information Services on Windows Server 2012
- Open DBxtra reports in web browser on a new tab
- DBxtra 7 – Migrate the DBxtra Repository from a Network Share to Report Web Service
- Report Web Service: How to retain the minimalist menu look on custom styles (Legacy Report Web Service DBxtra ver. 8.2.3 amd prior)
- The Report Web Service shows empty reports or dashboards
- Pass login information from an external application to the DBxtra Report Web Service
- Pass login information from an external application to the DBxtra Report Web Service (DBxtra version 9+ - Responsive)
- Deploying the Report Web Service to Azure (Web Sites)
- What happens to report objects style customizations when I change interfaces in the Report Web Service
Dashboard Interactivity
- Main
- DBxtra Dashboard Designer
- Design Dashboard
- Dashboard Interactivity
The Dashboard Designer lets you build interactive Dashboards with Master Filtering and Drill-Downs.
Master Filtering
The Dashboard allows you to use any data-aware dashboard item as a filter for the entire Dashboard (Master Filter).
End-users can select individual elements in a Master Filter to filter data in the rest of the dashboard by a selected – clicked – value.
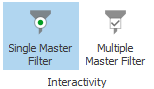
Enable Master Filtering
- To make a Dashboard item act as a Master Filter, click the Single Master Filter or the Multiple Master Filter button on the Interactivitymenu.
Note! Multiple Master Filtering allows you to select multiple elements and Single Master Filtering allows you to select only one element in the Master Filter item.
- To disable Master Filtering, use the Clear Filter button in the Dashboard item header.

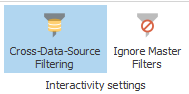
Filtering Across Data Sources
See also: Dashboard Add Additional Data Sources
When different items in a dashboard are bound to different additional data-sources, you can specify that a particular Master Filter should be applied across data sources.
Note! The filter will be applied to fields with matching names in all data additional sources.
Note! Fields are matched by their full names. For fields in other data sources to be affected by Master Filtering, their names must match the name of the field in the current data source, and they must belong to the same hierarchy level so that their full names also match.
- To enable filtering across data sources, click the Cross-Data-Source Filtering button on the Data – Interactivity Settings menu.
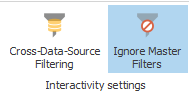
Preventing Items from Being Filtered
- If you want to prevent a specific Dashboard item from being filtered, select it and click Ignore Master Filter on the Data – Interactivity Settings menu.
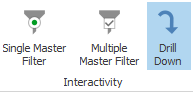
Drill-Down
The drill-down feature allows end-users to change the detail level of data displayed in an item. You drill down and view more detail data, or drill up to view more general data.
- To enable drill-down, select the dashboard items and click on the Drill-Down button on the Data – Master Data menu.
Note! If the selected Dashboard item contains several types of elements that can be used for drill-down, the menu will provide the appropriate buttons instead of the Master Filter button (e.g., Drill Down on Arguments and Drill Down on Series buttons for the Chart).
- To return to the previous detail level (drill up), use the Drill Up button within the dashboard item’s caption or in the context menu.
