-
-
-
-
-
- Data Grid
- Data Grid Columns
- Open a Data Grid
- Sort Data Grid Columns
- Filter Data Grid
- Data Grid Grouping
- Merge Cells in Data Grid
- Data Grid Formatting
- Data Grid - Conditional Formatting
- Data Grid - Calculated Fields
- Data Grid Drill Down
- Data Grid Views
- Generate Report from Data Grid
- Refresh Data Grid
- Copy Data Grid Records
- Export Data Grid Data
- Show all articles ( 1 ) Collapse Articles
-
- Pivot Grid
- Pivot Grid Areas
- Pivot Grid Fields
- Pivot Grid Summarize
- Format Pivot Grid Fields
- Expand - Collapse Pivot Grid Columns
- Sort Pivot Grid
- Pivot Grid - Calculated Fields
- Pivot Grid Filters
- Pivot Grid Drill Down
- Pivot Grid Charts
- Pivot Grid Maps
- Pivot Grid Views
- Refresh Pivot Grid
- Export Data from the Pivot Grid
- Embed Pivot Grid into Report
- Show all articles ( 1 ) Collapse Articles
-
-
-
- Dashboard Items
- Dashboard Chart Item
- Dashboard Pie Item
- Dashboard Data Grid Item
- Dashboard Pivot Table Item
- Dashboard Gauge Item
- Dashboard Card Item
- Dashboard Scatter Chart Item
- Dashboard Treemap
- Dashboard Range Filter Item
- Dashboard Filter Elements Item
- Dashboard Text Item
- Dashboard Image Item
- Dashboard Group Item
-
-
-
-
- Schedule Server Jobs
- Add a Schedule Job - Simple Email
- Add Schedule Job - Merged Email
- Add Schedule Server Job - Merged Report
- Add Schedule Job - Alert DBxtra Users
- Add Schedule Server - Export Report Objects
- Add Schedule Job - FTP Upload
- Add Schedule Job - Print Report
- Add Schedule Job – Google Drive Upload
- Add Schedule Job – Dropbox Upload
- Add Schedule Job – Data Dump
- Edit - Delete Schedule Server Jobs
-
-
-
- DBxtra - Excel Reporting Service
- Install the XL Reporting Service
- XL Reporting Service - Driver Requirements
- XL Reporting Service Interface
- Connect Excel Reporting Service to DBxtra Report Repository and Login
- Insert the Report Object's Data into Excel
- Refresh Your Data
- Open DBxtra Reports and Dashboard from within Excel
- XL Reporting Service Security
-
- Articles coming soon
-
-
- Migrating the Report Web Service from legacy (DBxtra version 8.2.3 and prior) to responsive (DBxtra version 9.0.0 +)
- DBxtra version 7.1.0 on Internet Information Server – IIS 6
- DBxtra 7.1.0 on Internet Information Server – IIS 7
- DBxtra version 7.1 – Upgrade DBxtra Report Repository to SQL Server Express.
- How to configure DBxtra to use Internet Information Services on Windows Server 2012
- Open DBxtra reports in web browser on a new tab
- DBxtra 7 – Migrate the DBxtra Repository from a Network Share to Report Web Service
- Report Web Service: How to retain the minimalist menu look on custom styles (Legacy Report Web Service DBxtra ver. 8.2.3 amd prior)
- The Report Web Service shows empty reports or dashboards
- Pass login information from an external application to the DBxtra Report Web Service
- Pass login information from an external application to the DBxtra Report Web Service (DBxtra version 9+ - Responsive)
- Deploying the Report Web Service to Azure (Web Sites)
- What happens to report objects style customizations when I change interfaces in the Report Web Service
Data Formatting and Data Shaping
- Main
- DBxtra Dashboard Designer
- Design Dashboard
- Data Formatting and Data Shaping
The Dashboard can be extensively formatted and shaped.
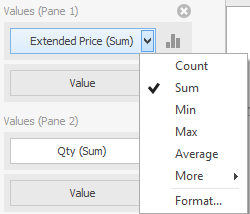
Formatting Numeric Values
- To define a format for numeric values, select Format from the Data Item menu.
 This invokes the Numeric Format window.
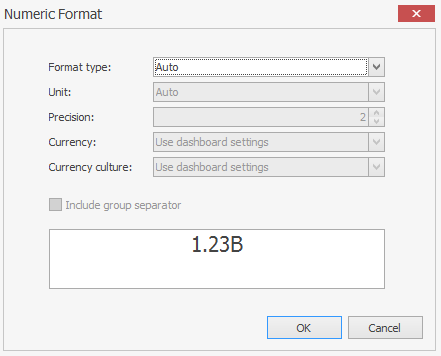
- In the Format type field, select the required format type.
Currency Format
- To define which currency to use for a data item, select Format from the Data Item menu.
- In the Numeric Format dialog, select Currency , in the Format type field and use the Currency drop-down box to select the preferred currency.
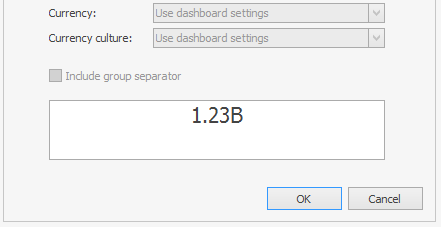
For regions with several cultures, you can also select the culture that will be used to format currency values.
Formatting Date-Time Values
- To define a format for date-time values, use the Format sub-menu in the Data Item menu.
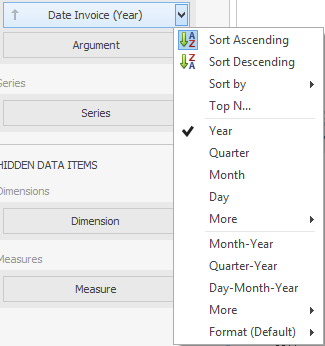
This sub-menu lists the available format types that depend upon the selected group interval (for details on group intervals, see Grouping).
Data Shaping
Summarization
To obtain numeric values that should be displayed within a dashboard item, the Dashboard calculates a summary function against the specified measure.
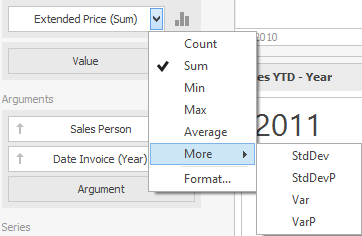
Changing Summary Type
The Dashboard Designer calculates by default Sum for numeric measures and Count for measures that contain another type of data.
- You can change the summary function type for numeric measures.
- Invoke the Data Item menu and select the desired summary type.
Note! Less common summary types are organized in the More sub-menu.
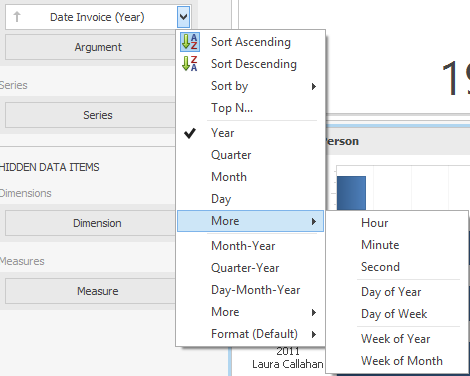
Grouping
Group on dimension values and display summaries for entire groups rather than individual values.
- You can arrange dimension values in groups of different sizes by specifying the appropriate group interval . For instance, date-time values can be grouped by years, months, quarters, etc.
Text Group Intervals
String values support the following grouping intervals.
Example : A, B, C, … ZDate-Time Group Intervals
Date-time values support the following group intervals.
Example: Year, Month, Quarter; Day, etc.
To change the group interval, invoke the data item menu and select the desired group interval.
Note! Less common group intervals are organized in the More sub-menus.
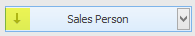
Sorting
You can easily change the sort order and you can also enable sorting by parameter values.
The sort order of dimension values is indicated with an arrow.
- To change the sort order, click the data item. You can also toggle sorting from the data item menu.
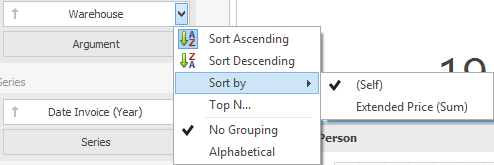
Sorting by Parameter Values
You can also sort dimension values by a specific parameter represented by a measure.
- To enable sorting by measure, use the Sort by sub-menu in the Dimension’s menu.
Filtering
You can apply filtering to each individual data Dashboard item.
Apply Filtering
Although we suggest to use filtering on the Query level you can also apply filters in the Dashboard Designer.
- Select the Dashboard item and click on the Filter button on the Data menu bar.
- You can also right click the Dashboard item and select Edit Filter.
Note! You can also use hidden dimensions in the Filter Editor dialog, allowing you to filter data based on their values.
Clear Filtering
- Select the Dashboard item and click on the Clear Filter button on the Data menu bar.
- You can also right click the Dashboard item and select Clear.
Top N
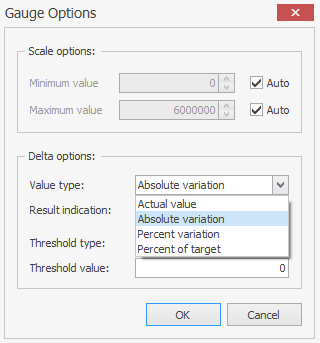
The Top N feature allows you to display only a limited number of values that correspond to the highest or lowest values of a particular parameter.
- To display the top values in a dimension, select Top N from the Data Item menu.
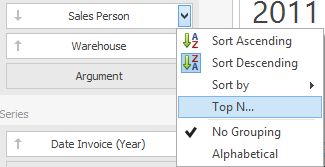
This invokes the Top N Values dialog.
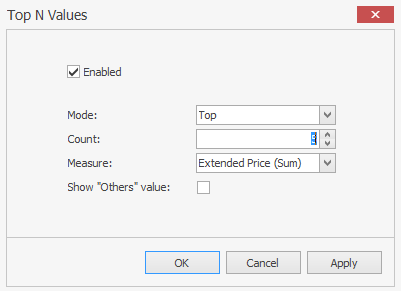
- In this dialog, check the Enabled check box and specify the following settings.
- Count: The number of values to be displayed.
- Measure: The parameter according to which the top or bottom values will be determined.
- Show Others value: If this option is enabled, all values that are not the top/bottom ones are consolidated in the “Others” value.