-
-
-
-
-
- Data Grid
- Data Grid Columns
- Open a Data Grid
- Sort Data Grid Columns
- Filter Data Grid
- Data Grid Grouping
- Merge Cells in Data Grid
- Data Grid Formatting
- Data Grid - Conditional Formatting
- Data Grid - Calculated Fields
- Data Grid Drill Down
- Data Grid Views
- Generate Report from Data Grid
- Refresh Data Grid
- Copy Data Grid Records
- Export Data Grid Data
- Show all articles ( 1 ) Collapse Articles
-
- Pivot Grid
- Pivot Grid Areas
- Pivot Grid Fields
- Pivot Grid Summarize
- Format Pivot Grid Fields
- Expand - Collapse Pivot Grid Columns
- Sort Pivot Grid
- Pivot Grid - Calculated Fields
- Pivot Grid Filters
- Pivot Grid Drill Down
- Pivot Grid Charts
- Pivot Grid Maps
- Pivot Grid Views
- Refresh Pivot Grid
- Export Data from the Pivot Grid
- Embed Pivot Grid into Report
- Show all articles ( 1 ) Collapse Articles
-
-
-
- Dashboard Items
- Dashboard Chart Item
- Dashboard Pie Item
- Dashboard Data Grid Item
- Dashboard Pivot Table Item
- Dashboard Gauge Item
- Dashboard Card Item
- Dashboard Scatter Chart Item
- Dashboard Treemap
- Dashboard Range Filter Item
- Dashboard Filter Elements Item
- Dashboard Text Item
- Dashboard Image Item
- Dashboard Group Item
-
-
-
-
- Schedule Server Jobs
- Add a Schedule Job - Simple Email
- Add Schedule Job - Merged Email
- Add Schedule Server Job - Merged Report
- Add Schedule Job - Alert DBxtra Users
- Add Schedule Server - Export Report Objects
- Add Schedule Job - FTP Upload
- Add Schedule Job - Print Report
- Add Schedule Job – Google Drive Upload
- Add Schedule Job – Dropbox Upload
- Add Schedule Job – Data Dump
- Edit - Delete Schedule Server Jobs
-
-
-
- DBxtra - Excel Reporting Service
- Install the XL Reporting Service
- XL Reporting Service - Driver Requirements
- XL Reporting Service Interface
- Connect Excel Reporting Service to DBxtra Report Repository and Login
- Insert the Report Object's Data into Excel
- Refresh Your Data
- Open DBxtra Reports and Dashboard from within Excel
- XL Reporting Service Security
-
- Articles coming soon
-
-
- Migrating the Report Web Service from legacy (DBxtra version 8.2.3 and prior) to responsive (DBxtra version 9.0.0 +)
- DBxtra version 7.1.0 on Internet Information Server – IIS 6
- DBxtra 7.1.0 on Internet Information Server – IIS 7
- DBxtra version 7.1 – Upgrade DBxtra Report Repository to SQL Server Express.
- How to configure DBxtra to use Internet Information Services on Windows Server 2012
- Open DBxtra reports in web browser on a new tab
- DBxtra 7 – Migrate the DBxtra Repository from a Network Share to Report Web Service
- Report Web Service: How to retain the minimalist menu look on custom styles (Legacy Report Web Service DBxtra ver. 8.2.3 amd prior)
- The Report Web Service shows empty reports or dashboards
- Pass login information from an external application to the DBxtra Report Web Service
- Pass login information from an external application to the DBxtra Report Web Service (DBxtra version 9+ - Responsive)
- Deploying the Report Web Service to Azure (Web Sites)
- What happens to report objects style customizations when I change interfaces in the Report Web Service
Dashboard Scatter Chart Item
You are here:
- Main
- DBxtra Dashboard Designer
- Dashboard Items
- Dashboard Scatter Chart Item
< All Topics
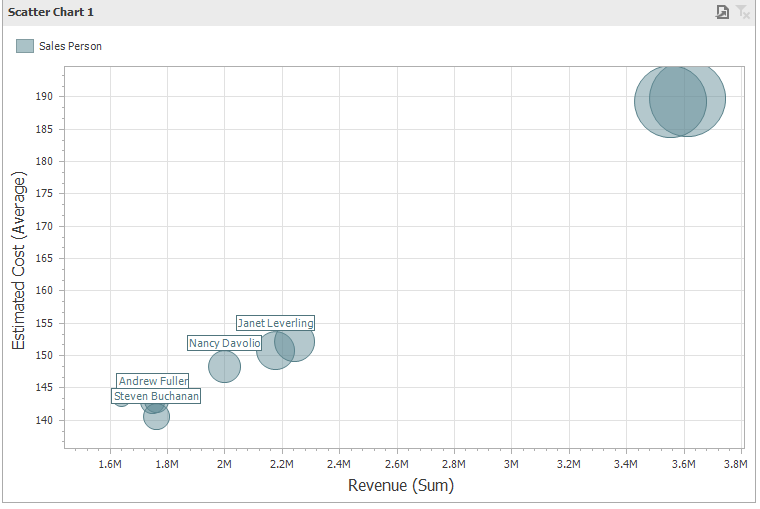
The below image shows a sample Scatter Chart.
Providing Data
- To bind a Scatter Chart item to data, drag and drop a data source field to a placeholder.
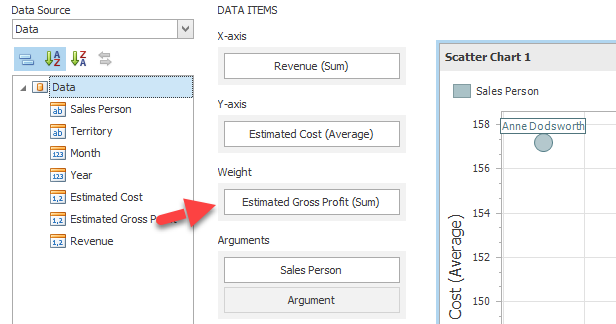
The below lists describes Scatter Chart data sections.
- X-Axis Measure Contains the data item against which the X-coordinates of data points are calculated.
- Y-Axis Measure Contains the data item against which the Y-coordinates of data points are calculated.
- Weight Measure Contains the data item whose values are used to calculate the weight of data points.
- Arguments Dimension Contains data items providing scatter chart arguments that are used to create data points.
Transpose X and Y axis
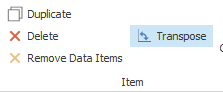
- To transpose the selected Scatter Chart dashboard item, click Transpose in the Home – Itemmenu.
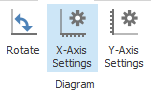
Rotate the Scatter Chart
- To rotate the Scatter Chart click the Rotate button on the Design – Diagram menu.
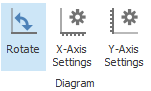
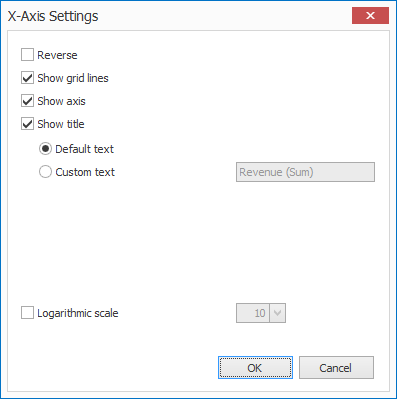
Define X-Axis and Y-Axis settings
- Click the X-Axis Settings and Y-Axis Settings to define settings.
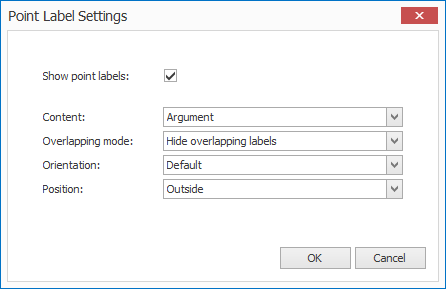
Define Point Label settings
- Click Point Labels in the Design – Labels menu.

Legend
- Click the Show Legend button in the Design – Legend menu to toggle this option.
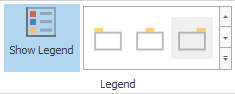
Table of Contents