-
-
-
-
-
- Data Grid
- Data Grid Columns
- Open a Data Grid
- Sort Data Grid Columns
- Filter Data Grid
- Data Grid Grouping
- Merge Cells in Data Grid
- Data Grid Formatting
- Data Grid - Conditional Formatting
- Data Grid - Calculated Fields
- Data Grid Drill Down
- Data Grid Views
- Generate Report from Data Grid
- Refresh Data Grid
- Copy Data Grid Records
- Export Data Grid Data
- Show all articles ( 1 ) Collapse Articles
-
- Pivot Grid
- Pivot Grid Areas
- Pivot Grid Fields
- Pivot Grid Summarize
- Format Pivot Grid Fields
- Expand - Collapse Pivot Grid Columns
- Sort Pivot Grid
- Pivot Grid - Calculated Fields
- Pivot Grid Filters
- Pivot Grid Drill Down
- Pivot Grid Charts
- Pivot Grid Maps
- Pivot Grid Views
- Refresh Pivot Grid
- Export Data from the Pivot Grid
- Embed Pivot Grid into Report
- Show all articles ( 1 ) Collapse Articles
-
-
-
- Dashboard Items
- Dashboard Chart Item
- Dashboard Pie Item
- Dashboard Data Grid Item
- Dashboard Pivot Table Item
- Dashboard Gauge Item
- Dashboard Card Item
- Dashboard Scatter Chart Item
- Dashboard Treemap
- Dashboard Range Filter Item
- Dashboard Filter Elements Item
- Dashboard Text Item
- Dashboard Image Item
- Dashboard Group Item
-
-
-
-
- Schedule Server Jobs
- Add a Schedule Job - Simple Email
- Add Schedule Job - Merged Email
- Add Schedule Server Job - Merged Report
- Add Schedule Job - Alert DBxtra Users
- Add Schedule Server - Export Report Objects
- Add Schedule Job - FTP Upload
- Add Schedule Job - Print Report
- Add Schedule Job – Google Drive Upload
- Add Schedule Job – Dropbox Upload
- Add Schedule Job – Data Dump
- Edit - Delete Schedule Server Jobs
-
-
-
- DBxtra - Excel Reporting Service
- Install the XL Reporting Service
- XL Reporting Service - Driver Requirements
- XL Reporting Service Interface
- Connect Excel Reporting Service to DBxtra Report Repository and Login
- Insert the Report Object's Data into Excel
- Refresh Your Data
- Open DBxtra Reports and Dashboard from within Excel
- XL Reporting Service Security
-
- Articles coming soon
-
-
- Migrating the Report Web Service from legacy (DBxtra version 8.2.3 and prior) to responsive (DBxtra version 9.0.0 +)
- DBxtra version 7.1.0 on Internet Information Server – IIS 6
- DBxtra 7.1.0 on Internet Information Server – IIS 7
- DBxtra version 7.1 – Upgrade DBxtra Report Repository to SQL Server Express.
- How to configure DBxtra to use Internet Information Services on Windows Server 2012
- Open DBxtra reports in web browser on a new tab
- DBxtra 7 – Migrate the DBxtra Repository from a Network Share to Report Web Service
- Report Web Service: How to retain the minimalist menu look on custom styles (Legacy Report Web Service DBxtra ver. 8.2.3 amd prior)
- The Report Web Service shows empty reports or dashboards
- Pass login information from an external application to the DBxtra Report Web Service
- Pass login information from an external application to the DBxtra Report Web Service (DBxtra version 9+ - Responsive)
- Deploying the Report Web Service to Azure (Web Sites)
- What happens to report objects style customizations when I change interfaces in the Report Web Service
Advanced Chart Wizard (Legacy version)
You are here:
- Main
- DBxtra Report Designer
- Chart
- Advanced Chart Wizard (Legacy version)
< All Topics
NOTE! This Quick Chart wizard – legacy – is only available for customer who installed DBxtra before September 15, 2017 (DBxtra version 9.3.1 and lower).
Tip! Usually you should place a Chart in the Report Header; Report Footer or in a Group Header or Group Footer section (Report Bands).
Important! It is recommended not to place the Chart in the detail section because you would get a Chart for each record.
- If necessary insert a new Section Band .
- Select the band where to place the Chart.
![]()
- Click the Advanced Chart (Legacy) button on the Report menu.
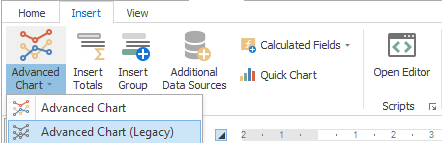
Chart type
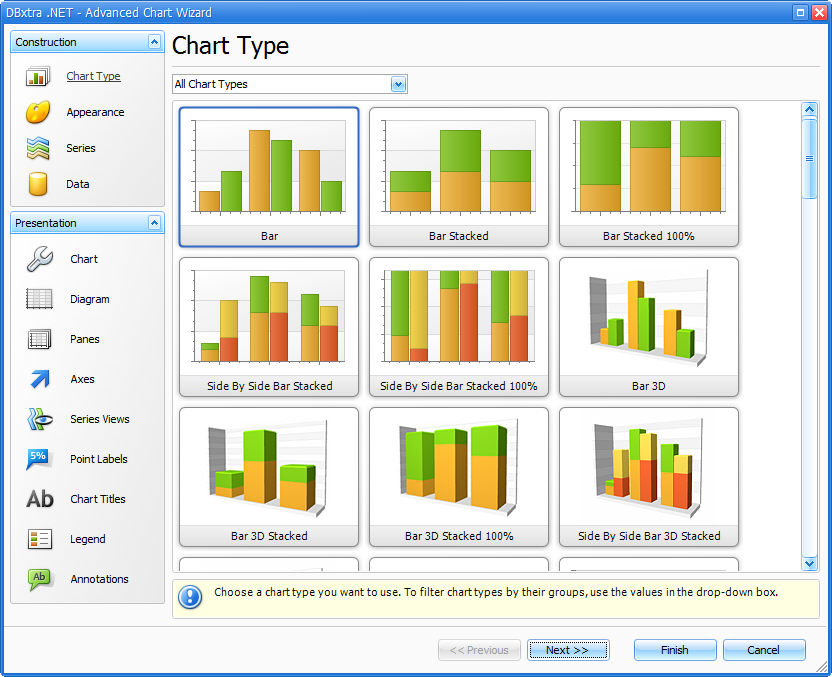
- Select the Chart Type .
Appearance
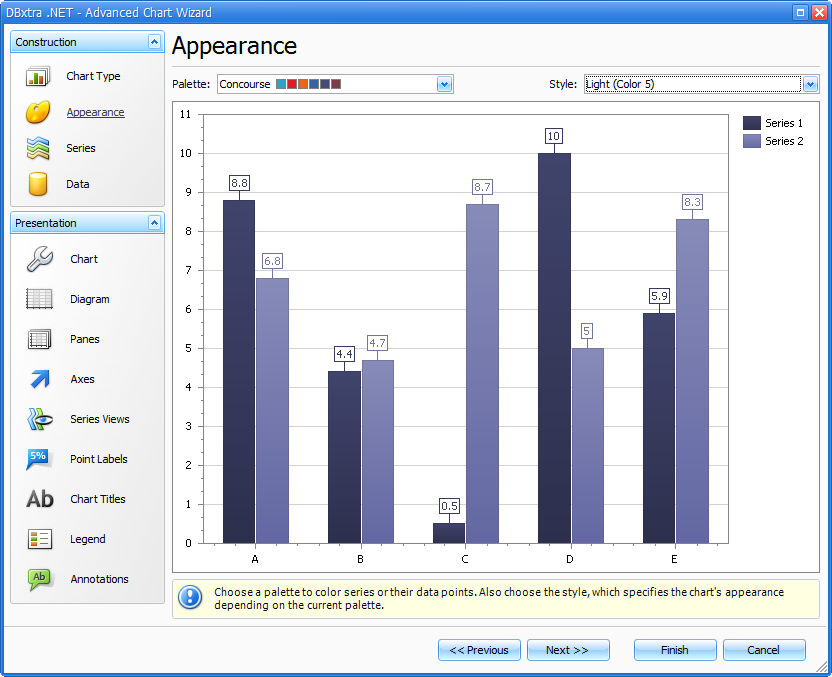
- Select the Palette and Style from the drop down boxes.
Series
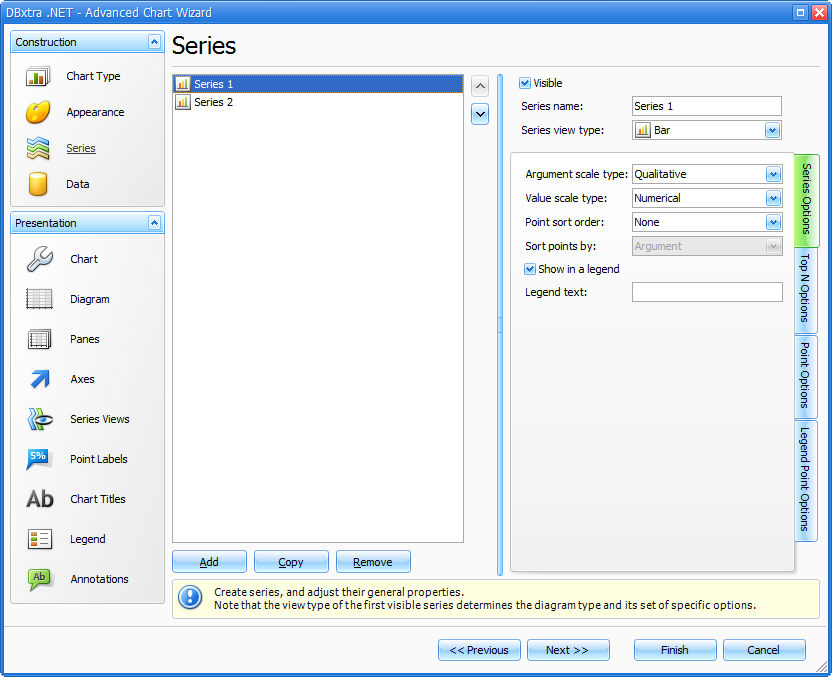
- Add or remove series.
- Assign a name for each series.
Data
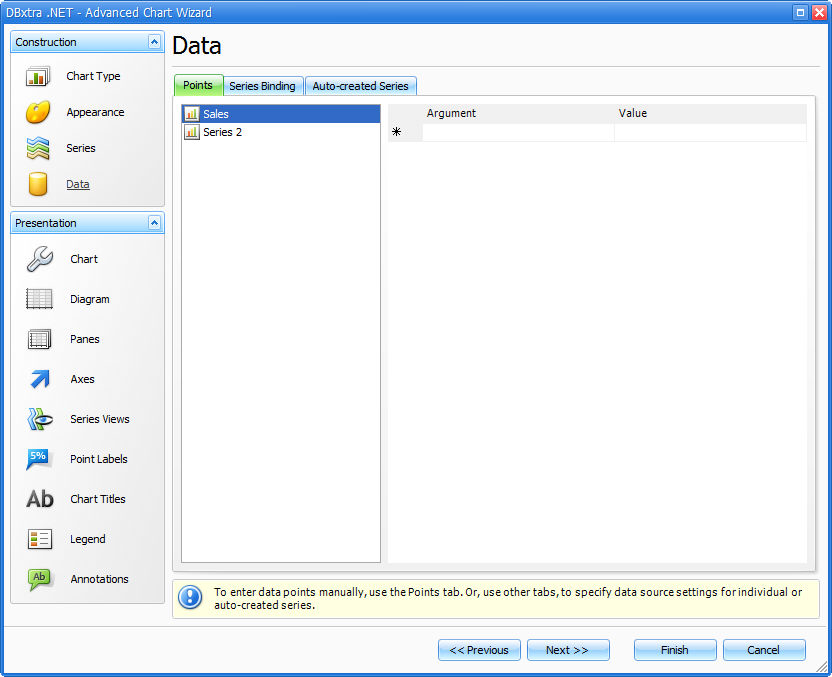
- Select the Series Binding tab.
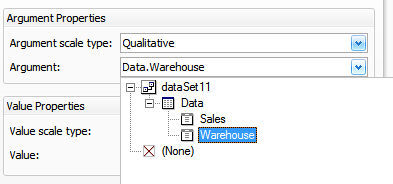
- Select the Argument Properties for the X axes .
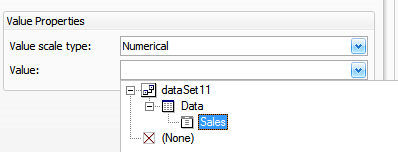
- Select the Value Properties value for the Y axes.
Chart
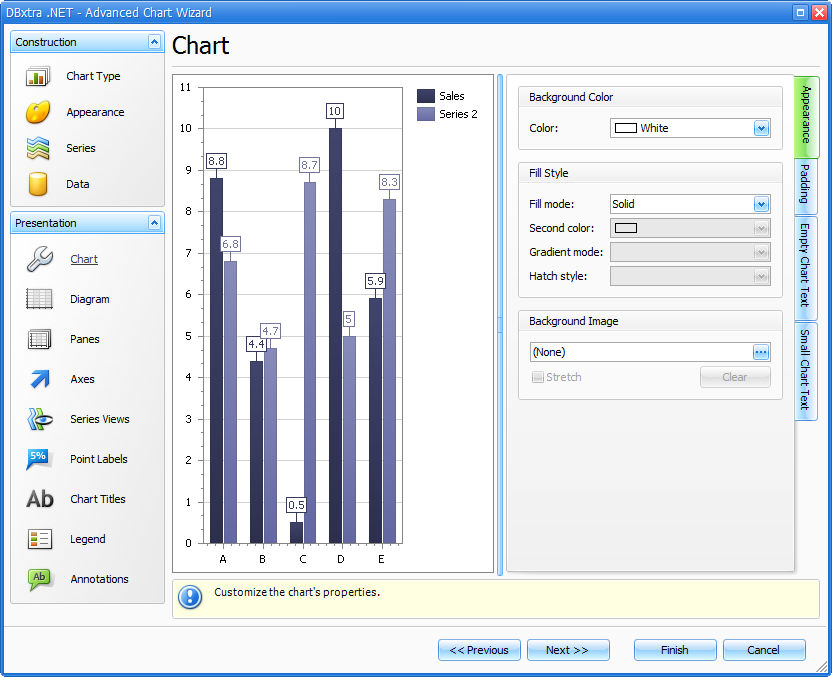
- Define Chart formatting.
Diagram
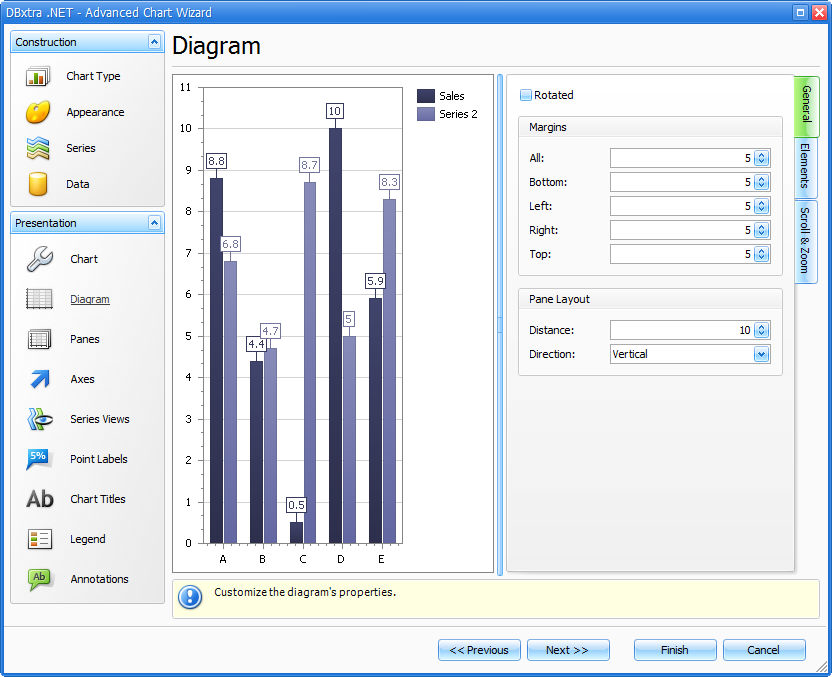
- Set your preferred Diagram values.
Panes
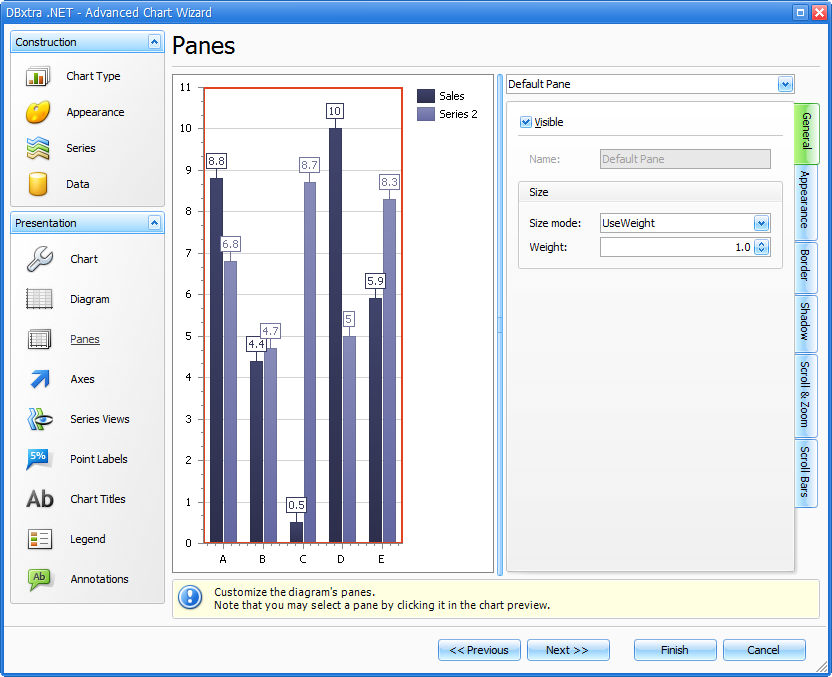
- Define Pane settings.
Axes
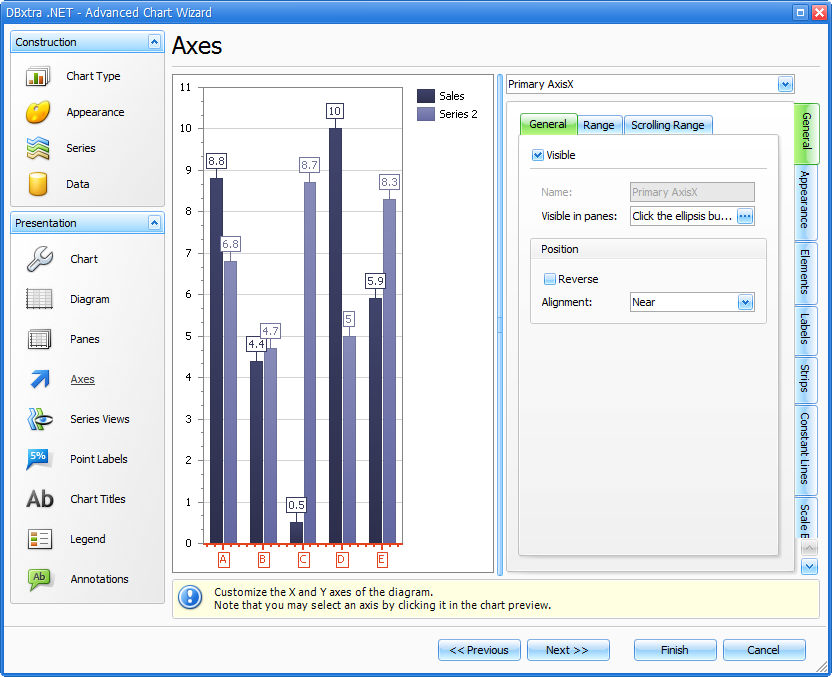
- Set your preferred Axes values.
Series Views
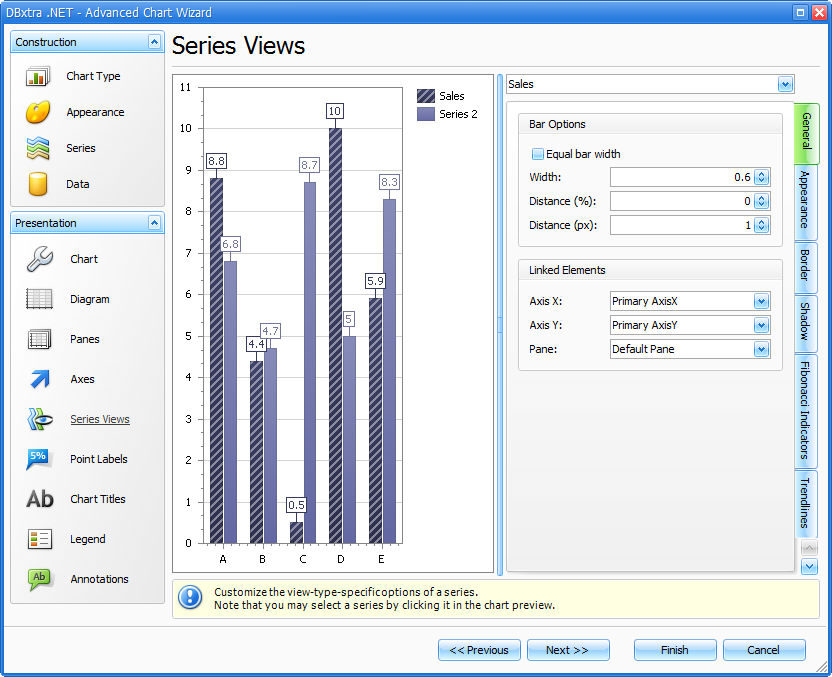
- Set your preferred Series views.
Point Labels
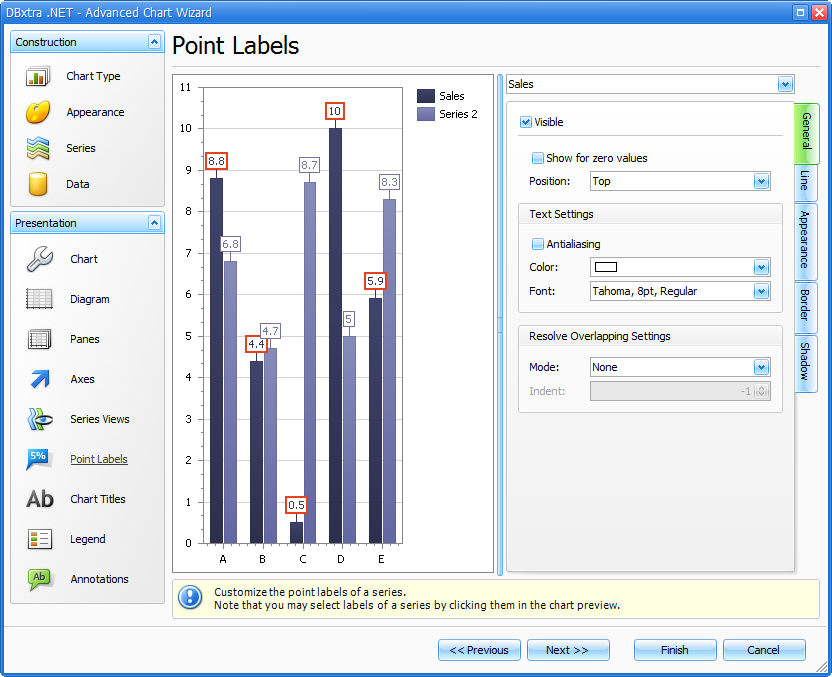
- Set Point Label definition.
Chart Titles
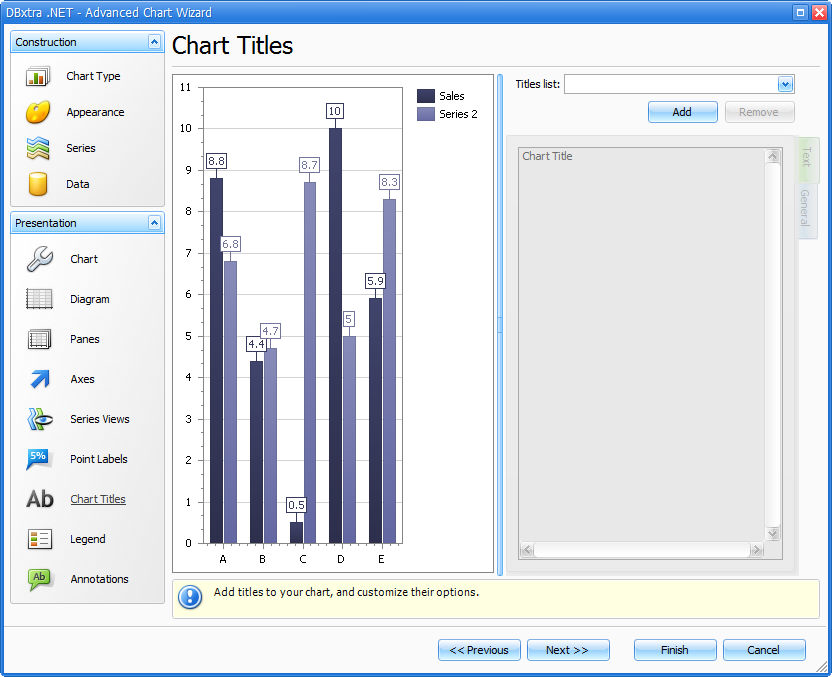
- Define your Chart titles.
Legend
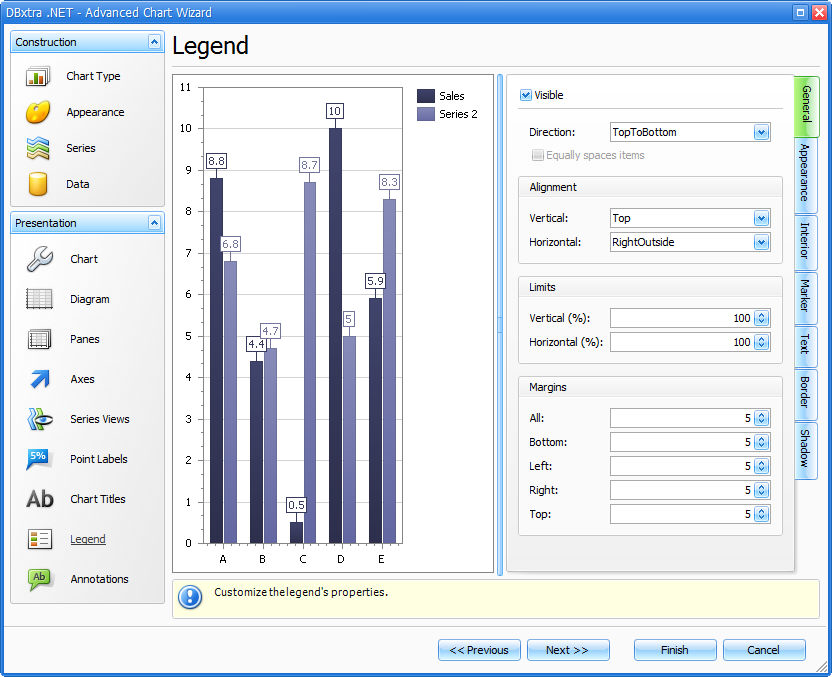
- Assign Chart Legend .
Annotations
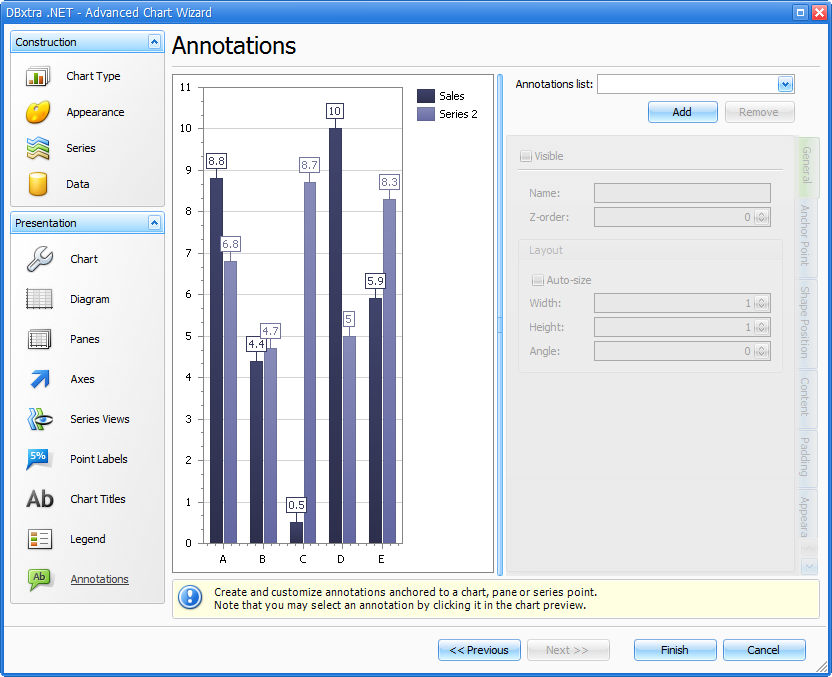
- Customize Annotations for the Chart.
- Click Finish to embed the Chart into the Report.
- Re-size and re-position the Chart.
Table of Contents